Description of TMCrys
Method description
TMCrys aims helping the crystallization of transmembrane proteins by providing prediction of the probability of success at several structure determination steps based on the sequence of the protein. XGBoost Decision Trees were trained on data from PDBTM database that hosts structures of transmembrane proteins and from TargetTrack database that was established as part of the Protein Structure Initiative and incorporated hundred of thousands structural genomics experiments. The testing was performed on a hold-out test set.
You can find further information in the paper describing TMCrys method:
Julia K. Varga and Gábor E. Tusnády
TMCrys: predict propensity of success for membrane protein crystallization
Bioinformatics (2018) 34, 3126–3130.
https://doi.org/10.1093/bioinformatics/bty342
Medline
Journal
PDF
Julia K. Varga and Gábor E. Tusnády
The TMCrys server for supporting crystallization of transmembrane proteins
Bioinformatics (2019) 35, 4203–4204.
https://doi.org/10.1093/bioinformatics/btz108
Creating training and test datasets
Training and test datasets for TMCrys were created using PDBTM and TargetTrack databases. Entries from PDBTM were categorized as positive examples for all three steps while entries from TargetTrack were sorted and categorized by the outcome of the experiments.
The training and test data for the whole process was created by using the positive training and test data of the crystallization step as the positive training and test set, respectively. For the negative dataset, the negative datasets of the three steps were concatenated.
Datasets were redundancy removed with CD-HIT package, first by using CD-HIT-2D to remove entries from the negative dataset with at least 60% identity to any entry from the positive set. Then, every dataset was clustered using CD-HIT with 60% identity threshold as well.
The datasets can be downloaded from here.
| Step | Success | Failure | Training | Test | Total |
|---|---|---|---|---|---|
| Solubilization | 2747 | 1086 | 3066 | 767 | 3833 |
| Purification | 2199 | 536 | 2188 | 547 | 2735 |
| Crystallization | 762 | 1605 | 1894 | 473 | 2367 |
| Whole process | 762 | 3188 | 3164 | 783 | 3950 |
Number of entries of the training and test datasets.
Calculating features
Machine learning features were calculated by external programs and in-house scripts. The following variable groups were calculated with the listed softwares and packages:

- CCTOP
- Membrane protein topology
- Signal peptide

- Amino acid composition
- Full length protein
- Transmembrane and extramembrane regions

- ProtParam
- Length, molecular weight, GRAVY
- Half life, instability index, pI


- NetSurfP
- Solvent accessible surface area
- Exposed and buried residues

- Sequence motifs
- Glycolisation (NX[ST])
- α-helical interaction (Gx{2,3}G)
Training and testing the model
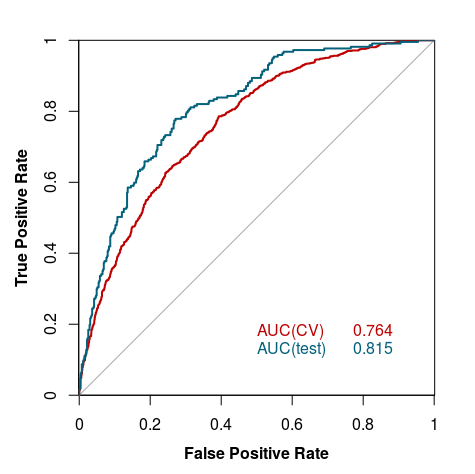
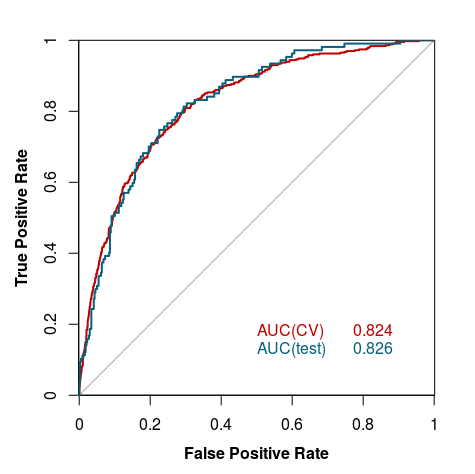
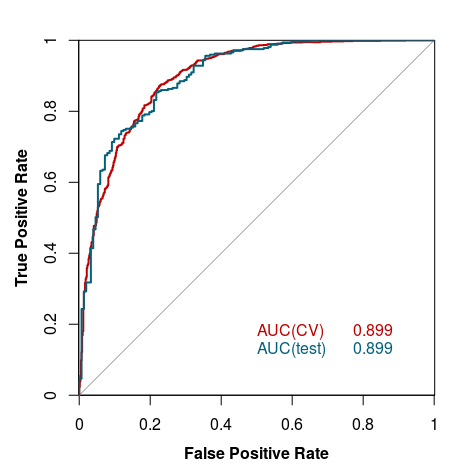
An XGBoost Decision Trees algorithm was trained using Bayesian Optimization. The classification thresholds were modified to balance sensitivity and specificity.
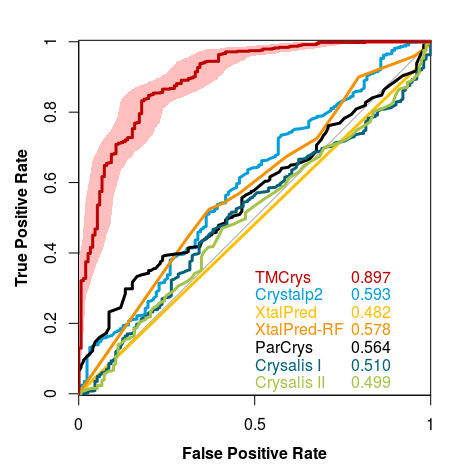
The model was validated using 10-fold cross-validation. The tests were performed on holdout test sets (described above), and for the whole process we used other available crystallization prediction methods listed under Curve 4.